CAD to GIS Spatial Data Conversion
• Design and Develop GeoDatabase
• Development of GIS Migration Tools
• GIS Mapping Automation
• PODS based Data Model Development and Data Loading

CAD to GIS Spatial Conversion and Digitization
 Development of the onshore integrated pipeline system
 Need for engineering knowledge automation
 Scaling and Movement of Alignment sheets
 Building, Cultivation area, Fence
 Overlay of field data to master data
 Preparation of delivery template
Development of the onshore integrated pipeline system
The development of the onshore integrated pipeline system is about leveraging spatial engineering technology for improving oil & gas engineering business processes in pipeline management. The business drivers include; laying the scientific foundation for visualising the complexities of upstream and midstream oil & gas pipeline network, which in turn will assist in enhancing the operation of gathering network, optimising hydrocarbon production, improving operational safety, protecting the
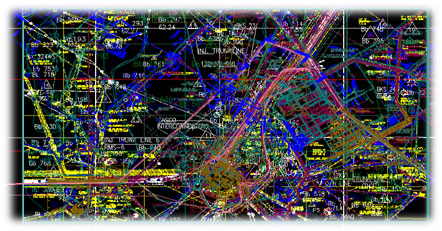
environment, maximising and discovering reserves in addition to maintaining a competitive edge. The project landscape is awash with multidisciplinary geospatial & engineering data sets, legacy systems, proprietary and vendor data, encompassing a storm of engineering and live data streaming in from the field to provide cross-disciplinary data transparency and collaborative working environment across all ADNOC group of companies.
Introduction
The current trend in collaborative petrotechnical, engineering and scientific computing knowledge management emphasises the importance of inter-n-intra-organisational engineering-n-knowledge management. Legacy engineering and CAD is gigantic wealth of information for OPCO’S, where the biggest challenge is the transformation from a traditional major oil company to a knowledge-driven organisation. The development of the onshore integrated pipeline master plan, integrating all assets under a common CAD/GIS umbrella is the first of many steps for OPCO’S in the process of its transformation to an asset-based technology-driven organisation.
Spatial and engineering data along with information associated with the functional properties of the entire onshore pipeline network comprising of pipe, field assets, equipment stations, manifolds and RSUs are captured and kept in the central knowledge repository of the OPCO’S corporate data vault. A sophisticated workflow has been developed as per company security guidelines and procedures for data retrieval and update from EDMS to keep the assets and network information current at all times.
The onshore pipeline system will not only be used to visualise the current assets and network in the geographical context, but it will also provide the smart engineering decision platform for planning and designing of geological and geophysical exploration, future field development, production operations, and operations planning of the gathering and transportation network.
The success of efficient planning and management of production wells, water and gas injection, and the gathering and distribution systems lies in the accuracy of the pipeline master plan. Geospatial engineering analysis along with mathematical modeling provides a unique visualisation capability, combining surface and subsurface data, along with production and operations information, both spatially and temporally. It is all about engineering knowledge management and engineering workflow management in a multi-dimensional environment on a real-time basis.
Engineering paradigm at OPCO’S
One of the key engineering challenges is to utilise manual update of all records and processes across the organisation to create, share and exchange work (knowledge) in a collaborative knowledge environment spread across multiple diverse locations. The pipeline master plan is the combination of processes, knowledge, and desired level of automation in a development framework that provides intelligent collaborative knowledge management with emphasis on the importance of inter- and intra-organisational business process engineering with the objective of transforming OPCO’S to a full asset based organisation. It is critical that these changes are implemented incrementally to minimise disruption and make the transformation manageable. In addition, an asset based organisation creates significant new opportunities for career growth.
Need for engineering knowledge automation
As crude oil production increases to meet global demand, OPCO’S is prevented from reaching the full potential for value creation from engineering automation, unless it can efficiently resolve its rapidly growing needs for human capital and resources. Closing the labour and skills gap represents one of the industry’s major factors in sustaining growth and maximising profitability against a tide of rising capital and operating costs. OPCO’S’s current model for deploying human capital, coupled with the sustained trend for capital expansion will require significant investments in finding and developing the high-cost professionals needed throughout the engineering value chain. Adopting the latest technologies through advanced automation, coupled with the intelligent visualisation of field operations and engineering activities will play a critical role in addressing this challenge and provide an edge to OPCO’S’s Engineering and Applications department.
The business objectiveThe business objective behind development of onshore integrated pipeline system is to provide a single engineering platform, that integrates the existing gathering and distribution pipeline networks of OPCO’S. The following are the defined business drivers:
- An engineering collaborative environment for the OPCO’S technical team, its vendors and stakeholders under single framework.
- A single framework for network & asset visualisation for and associated group companies.
- To meet forecasted engineering requirements and reduce the gap between supply and demand.
- A first step towards a GIS-based digital oil field initiative which will let OPCO’S gather and analyse the engineering, operational and maintenance data in real-time on 3D engineering framework.
- A platform for “advance engineering and operations alarming” systems, to predict performance levels and warn of potential equipment failure.
- Pipeline Master Plan – an information (historical and current) framework for timely decisions.
Development of an integrated onshore pipeline system
Pipelines have long been known to be the safest and most economical method for transportation of crude oil and natural gas. Pump stations dispersed throughout the lines keep the oil moving. They usually run twenty-four hours a day, seven days a week, three hundred and sixty five days a year. The entire pipeline operations are being monitored with real time data acquisition systems. Route safety inspections are done at regular intervals to look for leaking, rupturing and other inconsistencies. These operators and inspectors are trained to be prepared for any emergency. They can easily shut down a line or section if the need arises.
These pipelines network originates from wellhead through the tough terrain terminating at refinery and/or sea port. Several operating, controlling and monitoring assets/equipment are installed on along the entire pipeline network. The major pipelines are constructed using the alignment sheets which contains the greater engineering details and entire corridor geographical information. Since, alignment sheets were found most accurate and details engineering knowledge available with OPCO’S hence, it was used to develop the onshore pipeline network system.
Flow line does not have any “As Built Drawing”, hence the flow line information (layout and associated data) were captured from the Line Routing Plans. The plant details were captured from the Plant Layout. Similarly, several assets deployed along the pipeline network (including flow lines) were picked up along with its functional and engineering properties.
The complexity is that the data would be available in different data formats, and different scales. So data collation ensuring the desired accuracy would be the biggest challenge.
Processes
The data is to be captured from different sources. Most of the data already in CAD format. Data collation starts from locating the well to the right location as per its latitude and longitude. The flow lines are to be overlaid. Since, well has the flow line number and every flow line has well number so a home grown mathematical model is to be developed to logically connect the flow line with well. Similarly, the flow lines are to be connected to trunk line then to Main Oil Lines (MOL). Several assets and plants as coming across the network are also to be captured to build the spatial network. The communication network (fiber and copper), water network electrical network and railway line network also needs to be captured as these infrastructures are critical while planning the new well location and hydrocarbon (oil and/or Gas) collection network.
The 1 meter satellite data is needed to ensure that the entire pipeline network is accurate. Several desired features line, rig crossing, sand tracks, corridors, well fence can be captured from satellite images.
Biggest challenge
The major challenge in such projects is extraction of data from alignment sheets. Smart automation is needed towards capturing of data from alignment sheets, and automatically cleaning the pipe centerline data adhering to OPCO’S CAD manual, automatically picking the desired construction, corridor, crossing, surface and subsurface data from alignment sheet and appending it in the onshore pipeline system ensuring the scale and projection system. One can understand the project intricacy, that the data may be available across three projection system and multiple scales.
Future expansion
Development of pipeline master plan helps in jump start for OPCO’s policymakers for sustainable planning of upstream and midstream operation of oil & gas. The e-Landuse approval will for new projects will be done on the 3D environment. Pipeline master plan encompasses both, the engineering automation and the processes surrounding data and document management system across the entire suite of upstream and midstream activities, which will allow OPCO’s group of companies to capture more data, with greater frequency, from all parts of the oil and gas value chain and analyse it in real or near-real time. Thus, optimising reservoir, well, flow line & midstream operation, assets maintenance and facility performance. Initially, the information was available with few selected individual, but the proposed automation initiative of ADNOC enabled authorised user to share the intellectual assets, combined with collaboration, over powerful knowledge driven system across the OPCO’s corporate.
Input Analysis:
The input supplied by OPCO’S are to be being analyzed in terms of its completeness and continuity. Ensuring that none of the file gets corrupted or converted to different versions.
Data Analysis:
The Data in the file are reviewed and file based on type (DWG/PDF/JPG/GP4) need to be classified. The data file are further classified as per its type like (02/03/22/23/30). The set procedure is defined against every file type during data extraction as what information and data need to be picked up from which kind of file. Appropriate automation is deployed as per the input.
Line& Layer Analysis:
This is one time activity where the line type and corresponding layer and attribute is defined. But we do scrutinize the input to ensure that new layer/feature is not missing out. In case any new feature appears in the data and it is felt necessary for the project, it is being well captured and will be brought in the notice of OPCO’S with requisite layer definition recommendation. OPCO’S will approve the same (with necessary modification of required.) and it will be added up in the layer definition.
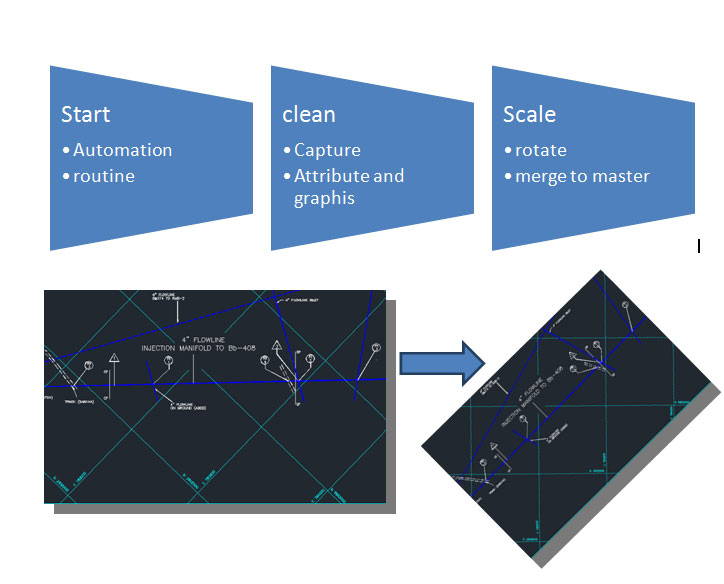
Scaling and Movement of Alignment sheets:
Under this procedure all the alignment sheets are scaled and rotated as per the master grid lines as shown below
Wells Extraction, Cleaning, Digitization and Attribution:
Well data is captured using automated tool from the table in “field Layout Drawings ”. 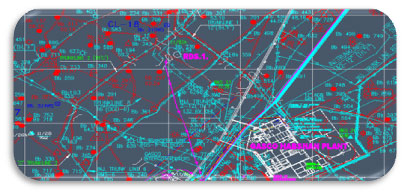 The well are generated automatically using Easting and Northing on the map and existing well (graphics) are verified ensuring that the plotted well and generated well must fall over each other. The well locations are further verified with satellite image
Road, Track and Rig:
Roads, tracks, rail, electric and telecom cables are picked up separately from profile files and line routing plan. The network infrastructures are QCed as per the TX and line crossing locations. The road are verified with respect to Satellite image also.
Cluster Data & Trig Point Data:
These data are captured from the “Field Layout Plans” and overlaid to the defined layer as per OPCO’S layer definition.
Building, Cultivation area, Fence:
Similar to site layout the building, fence and other features are captured in defined layer from Site plan, filed Layout Plan and General Drawings.
Overlaying and Cleaning of all the Files:
All the data from different sources are overlaid over each other. The alignment sheet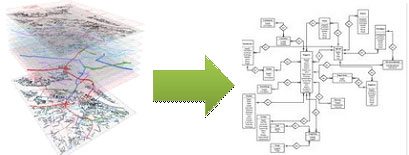 data is considered as most authenticated data and it is kept as primary data and other data are overlaid from various sources in respective layer and color as approved by OPCO’S.
Gap analysis:
Once data is overlaid, the gap analysis and data logical consistency analysis will be done. The non-conformance features will be reported to OPCO’S which may lead to field survey.
Field Survey:
On approval, the Survey team will visit to field for necessary survey. OPCO’S will provide the necessary permanent bench marks in the field for survey. In general, the DGPS and GPS will be used for survey. For any feature detailing within corridor the Total Station will also be used.
Overlay of field data to master data:
Once field data arrives to CAD production team, it will be reviewed and overlaid to the master data as per layer definition and attributes.
QC and QA of Merged Data
The QC is done layer by layer ensuring that:
- Right feature is in the right layer
- Right attribute table is present
- Right attribute data is present
- Features are joined together
- No hanging objects
- Polygons (fence, building etc.) are closed
- Road has got center line and data is with center line (side of road is only for CAD output)
- Roads are correct as per Satellite image.
- Gas well fence is as per satellite image.
- Data is consistent across the AOI
Preparation of delivery template:
The delivery template will be developed as CAD manual definition. These template will be used to produce the CAD paper output as per of delivery.
Preparation of output:
The master data will be cut as per the grid definition (as defined in CAD manual) and it will be brought in to template. This will be plotted on paper to review the layer color. The deliverables will be in respective “.DWG” format on Cd with covering letter describing the files CD/media contains.
CAD Handover:
The CAD data will be delivered to OPCO’S on CD with covering letter describing the CD contains.
GIS Database development and handover:
All the CAD data once approved and accepted by OPCO’S then it will be converted in to Geo-data model as per OPCO’S data model definition using workbench and final Geo-data will be delivered to OPCO’S.
Where the GeoData model will be as per the Pipe Data Model
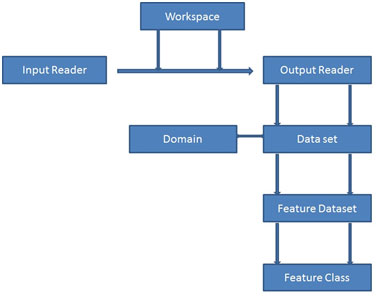
Data Migration using FME Workbench
Getting data into the precise format and structure you need doesn't need to be time-consuming. Whether you need to perform simple format-to-format conversion or complex translations involving data restructuring or content manipulation, FME provides the speed, flexibility, and automation you need to more easily master your data conversion.
Conceptual Diagram of Data Migration
The FME technology platform makes it easier to handle the diverse range of spatial data formats and evolving standards make interoperability such a challenge. With a unified view of your spatial and non-spatial data, you can better meet business goals and required standards, generating new insight across the organization.

Request a Callback
