3D Visualisation & DTM/DEM Modelling
• Integrated Pipepne Network
• 3D Models on Civil 3D
• 3D Pipepne Apgnment & Terrain Modelpng
• CAD/ GIS Based Apgment Sheet Generation

3D MODELLING AND REMOTE SENSING THROUGH GIS
 Pipeline Alignment, Terrain Modeling and 3D Visualization:
 Retracing and Pegging of TP’s using Total Survey Station.
 Satellite image processing and Ortho photo generation
 Pipeline Centerline Alignment in Civil 3D
 Remote Sensing Technology Assessment:
 DGPS Survey for capturing GCP’s.
 DGPS Survey of all TP’s and Crossings.
Technical Objective
Today availability of using the high resolution of space imagery, complex mathematical computational strength of server and GIS technology has created a positive environment on application of “Geo-remote sensing based scientific computing” technology for designing of new alignment of for pipelines.
The objective of is to evaluate the 3D Geospatial modeling, stereo pair remote sensing technology and 3D visualization technology for designing, development and production of AS-BUILT drawings.
Pipeline Alignment, Terrain Modeling and 3D Visualization:
Unlike the traditional way of designing the Oil & Gas pipeline alignment in which the design engineer manually tries to find out the alternative routes to access areas scheduled for harvest, or a rocky terrain difficult to dig/construct or a difficult crossing features like rail, river etc which may be difficult to negotiate during construction and may delay the progress, a computer aided 3D geospatial digital terrain modeling would be the best and technically advance way of addressing the need where the alternative pipeline alignments can be visualized in 3D interactive model. The engineering and socio economic feasibility can be done on the model and once agreed to final alignment; the cost of project and working detail drawing (alignment sheets) can be quickly derived out using 3D geospatial terrain model.
The 3D engineering model of final alignment will be used for both during initial phase of planning and also throughout the project life. Once model is ready it will be used during construction phase to monitor the progress and once project is on, it will be used to overlay the HCA and integrity matrix of alignment section.
Computer aided 3D geospatial digital alignment on terrain model will be comprising of multidisciplinary design data into visually rich virtual reality presentation that everybody can understand and view interactively. This results into more efficient communication, better design solutions and notable time and cost savings. When integrated into design process, it makes sure that project parties succeed and goals are achieved. Virtual Map truly adds new dimensions into design process.
The key feature of 3D model will be as following:
- Superior visual communication
- Easy to use
- Fun and inspiring – professional presentation
- Design simulation
- Design Analysis
- Earth work quality management
- Cross section view
- Plan, longitudinal profile, cross-sections and 3D presentation
- Notable time and cost savings
Real time Construction visualization and progress management
- Applicable till entire life of project
- Integrated engineering from design to drawing followed by visualization – All n 3D
Further, during all design phases it is important to be able to present the project in a professional manner. Users can activate pre-defined viewpoints and movement paths or move inside the Computer aided 3D geospatial digital alignment on terrain model freely using many different navigation modes. Tools like measuring, groups, object info, search and document links add new dimensions to presentations. It is also possible to save images and animation videos. But most importantly, Virtual Map activates people to communicate and give valuable feedback.
Nowadays, it is beneficial to do what we call “Integration modeling”. It means a dynamically updated virtual model of all design data from all design domains. During the whole design process the model is updated constantly to reflect the current design status. Designs can be reviewed using the virtual model instead of multiple paper prints. Viewing the design as a 3D virtual model gives the design process a whole new perspective. Conflicts like colliding structures, visibility obscuring objects, bad quality geometry or just unnoticed elements are immediately seen in the virtual model. The conflicts on crossing features can be saved as viewpoints with comments and sent back to the designers for fixing. This is an innovative new way of working and results in a much better project management and better solutions.
Our business intelligence systems bring geographic information systems, marketing analysis tools, and demographic data products together to offer you powerful ways to compete in today's business strategies.
GIS provides essential marketing and customer intelligence solutions that lead to better business decisions. With GIS, you will have the tools you need to analyze
- Site selection and location analysis.
- Class identification & Engineering.
- 3D visualization and Fly through.
- Proactive Consideration of Environment factors.
3D Terrain:
A digital elevation model is a digital model or 3-D 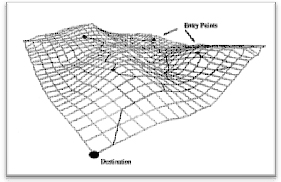 representation of a terrain's surface. It is created from terrain elevation data. In the most cases the term digital surface model represents the surface and includes all objects on it. In contrast to a DSM, the digital terrain model represents the bare ground surface without any objects like plants and buildings. Once satellite stereo feature data in overlaid on the DTM is becomes DSM.
Digital elevation models can be developed in a number of ways, but they frequently use remote sensing rather than direct survey data is always recommended. One powerful technique for generating digital elevation models is interferometric synthetic aperture radar: two passes of a radar satellite (such as RADARSAT-1 or TerraSAR-X), or a single pass if the satellite is equipped with two antennas (like the SRTM instrumentation), suffice to generate a digital elevation map tens of kilometers on a side with a resolution of around a meters. Alternatively, other kinds of stereoscopic pairs can be employed using the digital image correlation method, where two optical images acquired with different angles taken from the same pass of an airplane or an Earth Observation Satellite (such as the HRS instrument of SPOT5 or the VNIR band of ASTER).
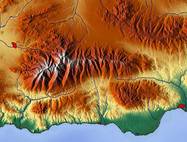 Older methods of generating DEMs often involve interpolating digital contour maps that may have been produced by direct survey of the land surface. This method is not very much in practice provided it is not a dense forest and in such cases the DGPS is used to capture the spot elevation.
Further the quality of a DEM is a measure of how accurate elevation is at each pixel (absolute accuracy) and how accurately is the morphology presented (relative accuracy). Several factors play an important role for quality of DEM-derived products:
- terrain roughness;
- sampling density (elevation data collection method);
- grid resolution or pixel size;
- interpolation algorithm;
- vertical resolution;
- terrain analysis algorithm;
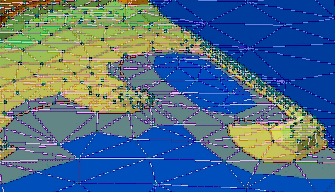 Following are the input used to develop the DTM model
- Stereo Satellite imageries (4 Mts LISS)
- Real Time Kinematic GPS
- Topographic maps
- total station
- GCPs taken by DGPS
- Inertial surveys
Remote Sensing – The Technology
In emerging technology paradigm, “Geographical Information System (GIS)” has emerged as powerful tool which has potential to organize complex spatial environment with tabular relationships between the pipeline and integrity management database. The emphasis is on developing digital spatial database, using the data sets derived from precise navigation and imaging satellites, aircrafts, digitization of maps and transactional databases. The power and potential of GIS is limited only by ones imagination.
However to exploit the technology to benefit the corridor monitoring process there is need to initiate a process for integration of data, based on Interoperable open standards, specifications & formats. The enormous demand for the storage, analysis and display of complex and voluminous data has led, in recentyears, to the use of Geographic
Information Systems for effective data handling and also for analyzing and geographically transferring the information around the corridor. It is, therefore, essential to devise the ways and means of organizing computerized pipeline corridor information system. These systems must be capable of handling vast amount of data collected by modern techniques and produce upto date information. Remote Sensing technology has already demonstrated its capabilities to provide information on natural resources, soil patter change, unwanted activities prediction, unwanted land-use, soil erosion, etc on regular basis. Similarly, Geographic Information Systems (GIS) are the latest tools available to store, retrieve and analyze different types of data for management of natural resources. GIS facilitates systematic handling of data to generate information in a devised format. Thus it plays an important role in evolving alternate scenarios for natural resources management.
Remote Sensing (RS) data and Geographical Information System (GIS) play a rapidly increasing role in the field of pipeline corridor monitoring. One of the greatest advantage of using RS data for corridor change deduction modeling and monitoring is its ability to generate information in spatial and temporal domain, which is very crucial for successful model analysis, prediction and validation. However, the use of RS technology involves large amount of spatial data management and requires an efficient system to handle such data. The GIS technology provides suitable alternatives for efficient management of large and complex databases.
Image data have been used as a primary source of natural resources information in thematic mapping which in turn is utilized in various corridor health studies. The remote sensing data provides synoptic view of a fairly large area in the narrow and discrete bands of the electromagnetic spectrum at regular intervals. The space borne multispectral data enable generating timely, reliable and cost effective information on various natural resources, namely surface water, ground water, land use/cover, soil, forest cover and environmental hazards, namely waterlogging, salinity and alkalinity, soil erosion, human activities etc.
Remote Sensing Technology Assessment:
There are airborne, unmanned aerial vehicles (UAV) and satellite Synthetic Aperture Radar and LIDAR multi-spectral and hyper-spectral sensors could be used for pipeline monitoring. But one of “Proof of Concept” i.e. the feasibility study of appropriate satellite imageries and associated technology for monitoring transmission network needs to be tested out before implementing it across the entire network of Pipeline Operators. Objective of this approach is to ensure:
- The kind of satellite imageries required
- Frequency of satellite data depending on cloud conditions
- Process of its procurement
- Mathematical model for image processing
- Tools and technology required
- Data modeling
- Data safety& security
- Integration of systems
- Proposed automation to be included in the solution
- Survey need
- Definition of warning, notification, alarm and alert
- An integrated system definition
- Expected cost and duration.
DGPS Survey for capturing GCP’s.
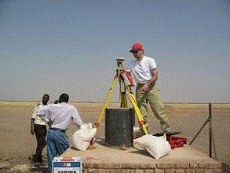 The Ground Control Points were established in the corners of the forecasted imagery Blocks and the center of each block. Additional GCP’s was added in strategic locations of the blocks, depending on the shapes of blocks and the number of the strips covering the area.
A sufficient number of GCP’s were made available and ensuring that maximum AT block stability and accuracy is achieved.
The accuracy of these GCPs will be smaller or equal to + 1M
Retracing and Pegging of TP’s using Total Survey Station.
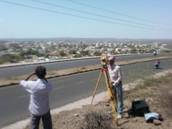 In order to peg the Turning Points on the ground, they were re-traced using Total Survey Station and peg was installed.
DGPS Survey of all TP’s and Crossings.
Features mapped while carrying out Survey are;
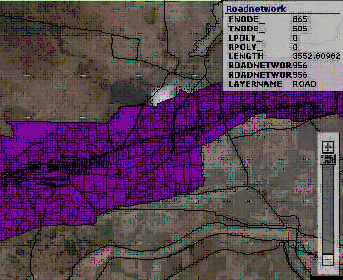
Pipeline
- TP's
- IP's
- GCP's
Crossings
- Roads
- Highways
- Canals
- Power Lines
- Water Bodies
In order to peg the Turning Points on the ground, they were re-traced using Total Survey Station and peg was installed.
Feature Extraction from Satellite Imagery.
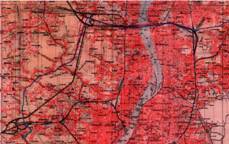 Analysis of existing data: it is important to analyze the existing data (maps, satellite images, tables and reports) available with pipeline operator. A process of verification was carried out on the existing data for the authentication of the quality. It was checked the attributes, errors of undershoots & overshoots, locations, connectivity etc.
For the base map creation some raster maps (toposheets, satellite images and other paper maps) were scanned and converted to the digital format. Then digitization was carried out and survey data integrated with the GIS data layers. A process of geocoding the details of the survey data and other attributes was done in GIS environment. Then final data was published on the web server system for the client verification and other users availability.
Preliminary Alignment :
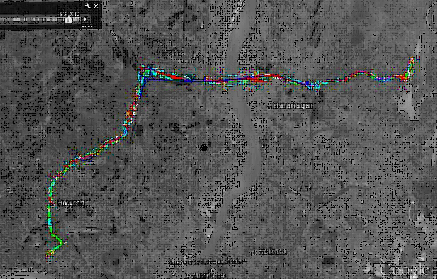
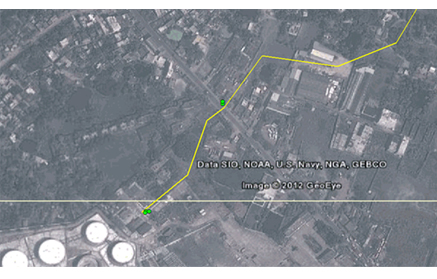
The preliminary alignment was placed on Google map to ensure the corridor and TPs. The TPs were surveyed using DGPS and high resolution satellite image and stereo pair generated DTM was used to refine the alignment
Satellite image processing and Ortho photo generation
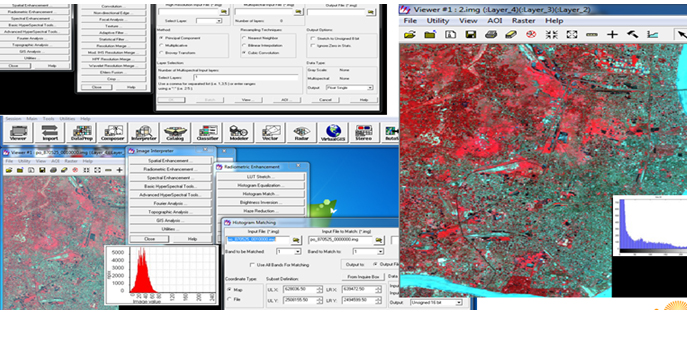
Satellite data comes in binary format. Extracting the valuable information from satellite needs to convert the binaly DN values in to representative FCC colored image. This is known as image processing. In ATF pipeline two images were used. (a) PAN (1 M, single band) and Multispectral (3 band – RBG; 4 M). These images were merger to sharpen the data. SOI and GCPs were used to develop the ortho photo generation.
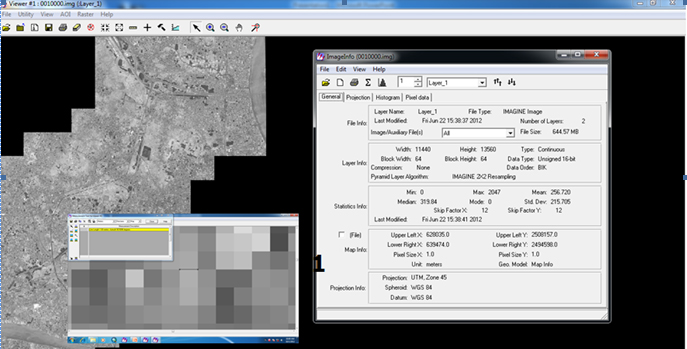
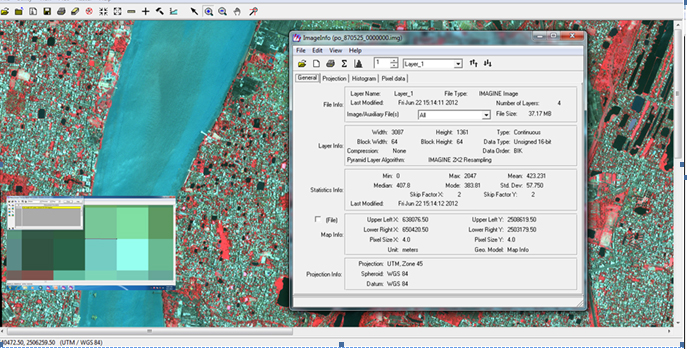
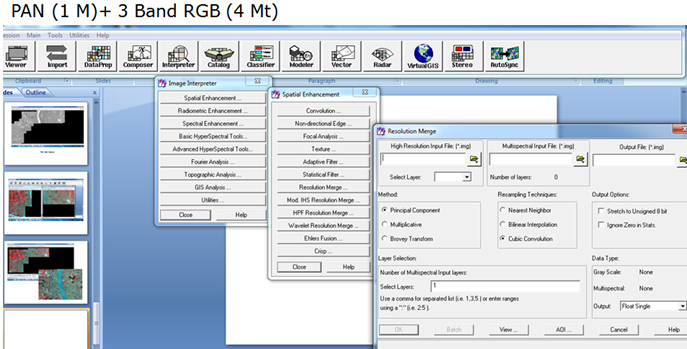
Histogram equalization is done to sharpen the image to the best pixel level. Satellite Images acquired through satellite sensors contain camera and terrain related distortions which make the images unsuitable for geospatial analysis, and DTM modeling as positions within the image may be significantly inaccurate Orthorectification converts imagery into map-accurate form by removing camera and terrain related distortions from the imagery through the use of sensor and terrain (elevation) information. The resulting orthoimages, also known as orthomaps, can be directly applied in GIS based 3D alignment for ATF line. Ortho image generation is the mathematical modeling establishing relationship between object and pixel space needed to be established. This mathematical modeling is determined by the exterior orientation with the use of extended co-linearity equations and GCPs. Since Space Imaging (SI) does not release information about the sensor model and no typical Rational Polynomial Coefficient can be used as this modeling is very much dependent on geography, altitude and terrain slope.
Development of DTM Model:
 A Digital Elevation Model (DEM) is a regularly spaced raster grid of elevation values of a surface terrain. DEMs can be used to produce maps such as contour maps, orthophoto maps, and perspective maps. DEMs can be used to exactly map the surface terrain which will be ultimately deployed for 3D line planning and design. The DEM Extraction Module enables the extraction of elevation data from stereo images – came from satellite imagery. It is important that the imagery have associated rational polynomial coefficients (RPCs) which contain necessary information about the sensor model. In addition, RPCs are used in tie point generation and to calculate the stereo image pair relationship.
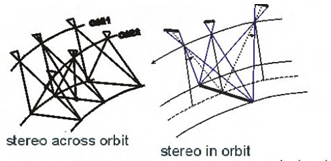
The DEM extraction process requires a stereo pair of images containing RPC positioning from either an along track or an across track satellite acquisition. Along track stereo images are acquired on the same orbital pass by a satellite which usually has more than one sensor looking at the Earth from different angles. Across track stereo images are those taken by the same sensor on multiple orbits.
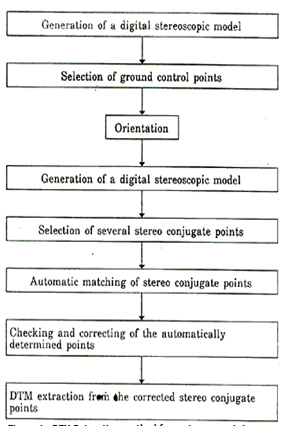
DEM extraction is a multi-step decision making process involving the setting of many parameters used in different steps. These steps can be run individually from the ERDAS menu options, or from within the DEM Extraction Wizard. The Wizard guides you through nine steps. It presents you with objective parameters, such as minimum/maximum elevation of the area of interest, as well as other strategy parameters that depend upon the terrain relief, cultural content, image quality, shadowing, and the desired speed of operation.
As with the DEM Extraction Wizard, extracting a relative or absolute DEM from a stereo pair of images can be accomplished using the Stereo Pair 3D Measurement Tool and Epipolar 3D Cursor Tool to create an output DEM.
The Stereo Pair 3D Measurement Tool allows you to select a common point from two stereo images and calculate an elevation value for that point .
The Epipolar 3D Cursor tool allows to perform 3D measurements in a 3D stereo viewing environment based on an existing epipolar stereo pair of images. It is easy to view an anaglyph of epipolar stereo imagery and adjust the apparent height of the cursor to extract elevation data.
Creating a DEM
There are three steps in creating a DEM that are crucial to generating acceptable results: epipolar image creation, image matching, and DEM geocoding.
Epipolar Image Creation - The creation of epipolar images is an essential processing step in DEM extraction. Epipolar geometry describes the geometrical constraint between two frame images of a stereo pair. It represents the fact that a ground point and the two optical centers lie on the same plane. This means that for a given point in one image, its conjugate point in the other image must lie on a known line in the second image. By creating epipolar images, the search space for finding corresponding image points in automatic image matching is reduced. For information about building epipolar images for the use with DEM Extraction Wizard, see Building Epipolar Images.
Image Matching - Image matching finds the conjugate points on both the left and right images which correspond to the same ground feature. The output of the image matching procedure is called a parallax image, in which the x-coordinate difference (along epipolar lines) between the left and right image is stored and is used to build the DEM. Thus, the quality of image matching largely determines the quality of the output DEM.
DEM Geocoding - DEM geocoding re-projects the DEM from the epipolar projection to the user-specified output map projection and units. This step involves the filling of failed pixels and the resampling to a pixel spacing specified by the user. When GCPs are provided, the absolute orientation of the computed terrain model is performed in this step.
Output DEM
A relative DEM is a DEM with possible differences in position, scale, and rotation from the geodetic coordinates on the ground (horizontal reference system) and the mean sea level (vertical reference system). If the satellite imagery does not have ground control point (GCP) information associated with it, the DEM Extraction Wizard can derive a relative DEM result.
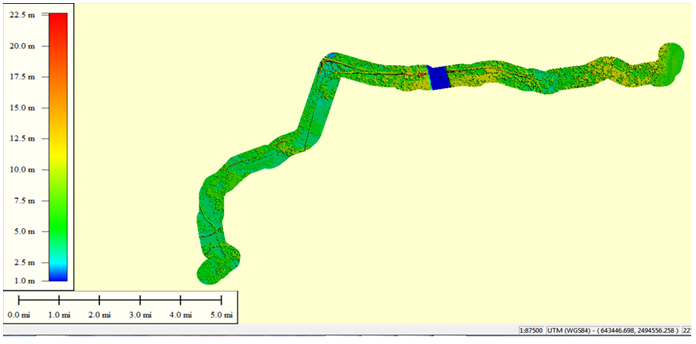
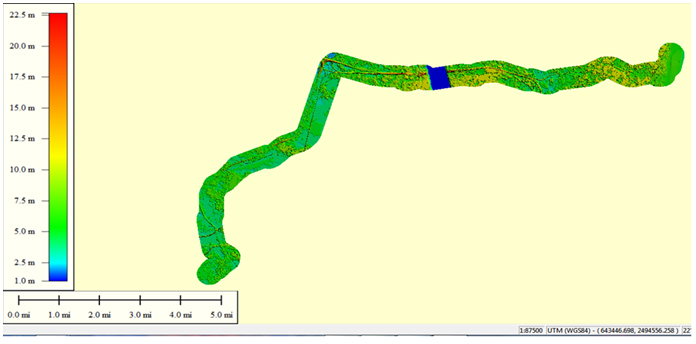
An absolute DEM was developed in the pipeline project as it the horizontal and vertical reference systems tied to geodetic coordinates. This helped developing the entire alignment in 3D on single GIS+ DTM model.
DTM Overlay on Satellite Land Use:
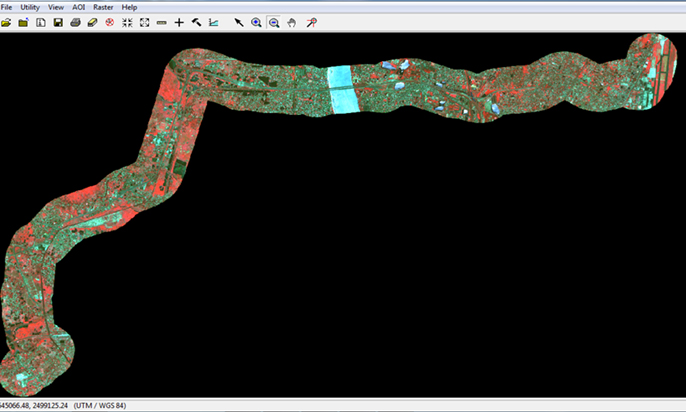
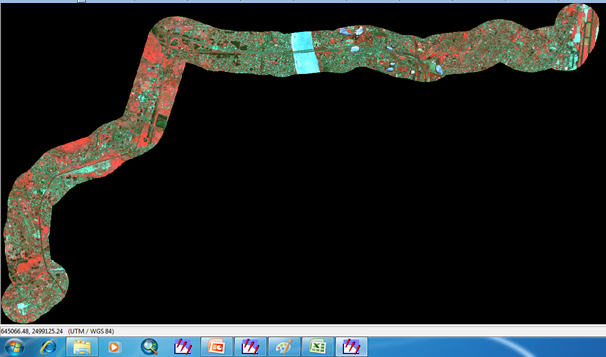
The DTM (Elevation data) was overlayed on the 2D pan sharpened satellite image and a 750 Mts either side buffer was created. This model was taken in to 3D Civil module for pipeline alignment .
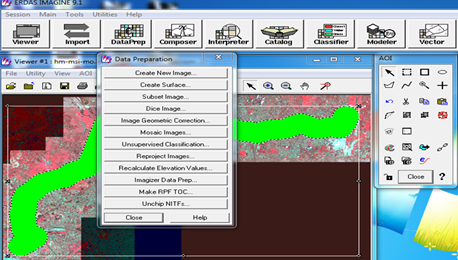
DTM+ Pan Sharpen Image of Buffer
Ground Surface model:
The DTM and Satellite image was taken in to Civil 3D. The centerline land coordinates were available. The TIN model was developed to define the ground surface model as shown below.
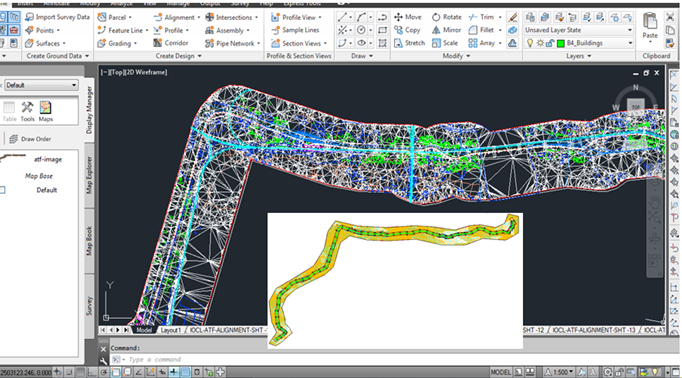
Pipeline Centerline Alignment in Civil 3D
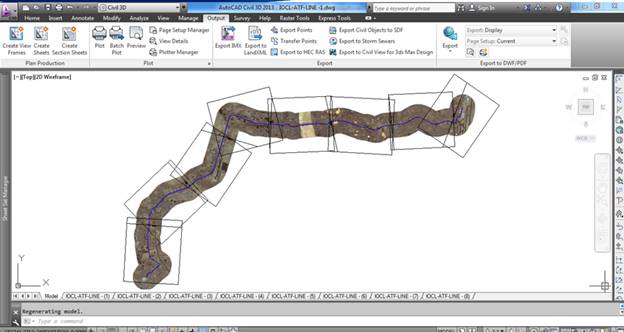
In Civil 3D the IPs were placed. The centerline object (3D polyline) was placed passing through the IPs. The circular arcs and spirals were fit at every IPs ensuring R>400D criteria. The vertical section along the terrain was derived from the DTM in Civil 3D environment. The alignments are combined with profiles and assemblies (cross sections) to create 3D design models called 3D centerline.
Alignments in Civil 3D are dynamic objects linked to the profiles and corridors that depend on them, which means that changing an alignment through a table of design data or through on-screen grip editing automatically redefines the alignment and updates profiles and corridors accordingly.
Object Styles
Civil 3D uses object styles was developed as per clients design template to control the display and annotation of objects such as points, alignments, profiles and so on. Alignment geometry and labels automatically appear in the alignments in real time based on selected alignment styles and alignment label styles.
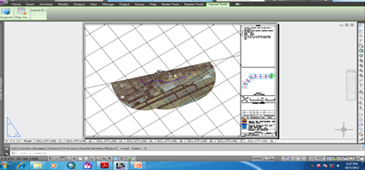
Creating Alignments
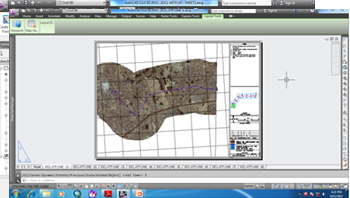
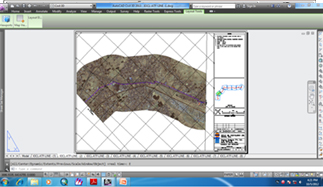
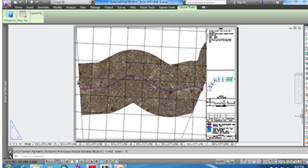
In Civil 3D from polylines passing through TPs fitted with circular and spiral curves ( R > 40D) was used to develop the vertical alignment. It was developed by joined polyline with Alignments/Create Alignment from Polyline to ensure that every cross section comply to design. This approach found best as it was real-time computing the depth of pipeline from the soil surface.Typical As-Built layout was used to develop the construction drawings.
Cutting the Corridor on Satellite Imagery
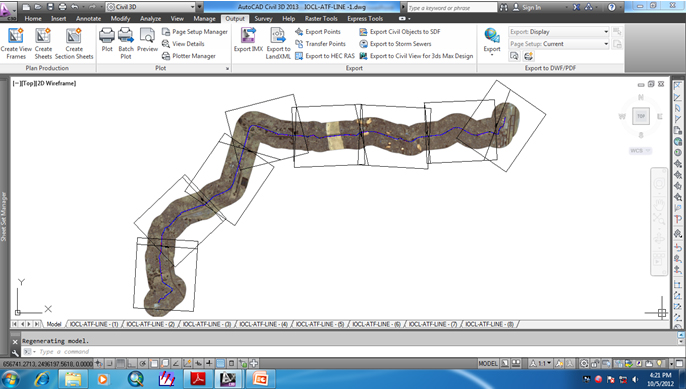
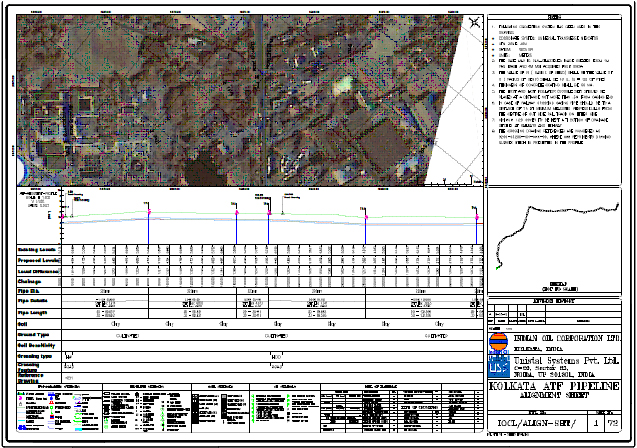
2D Alignment Sheet Generation
Planimetry Alignment
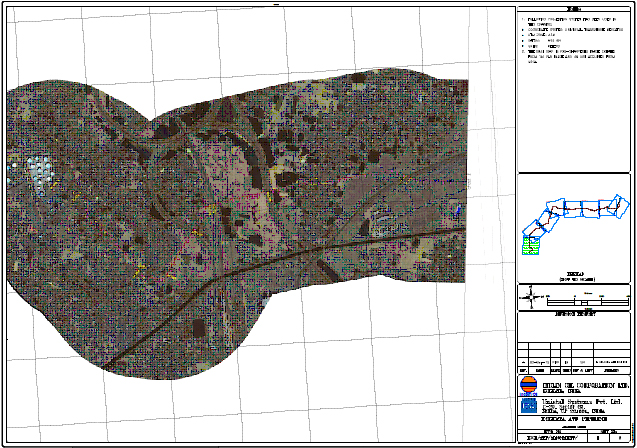
3D Alignment Sheets
Extraction of model :
The Civil 3D model with terrain was extracted out in to infrastructural modeler for development of 3D virtual Digital City Pipeline visualization.
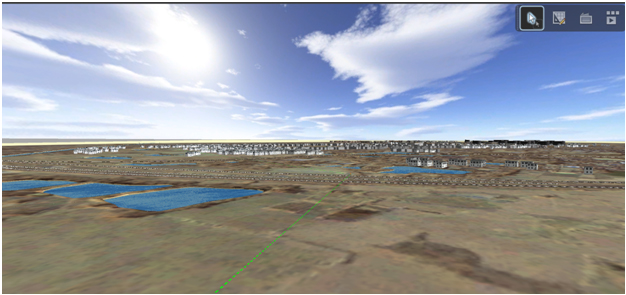
Development of 3D visualization and animation using DTM
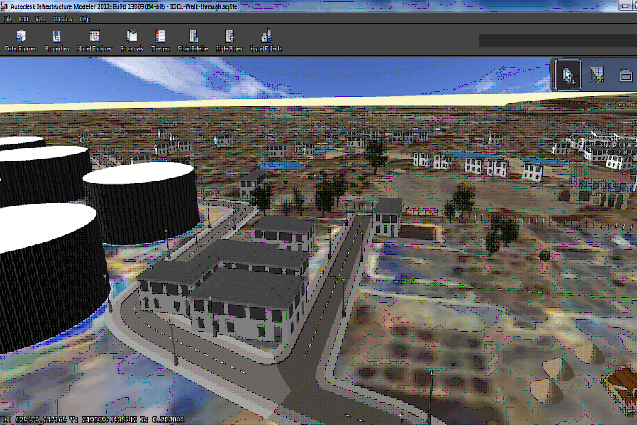
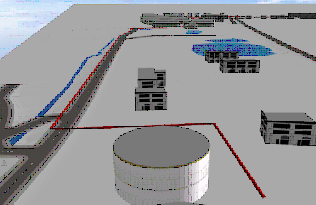
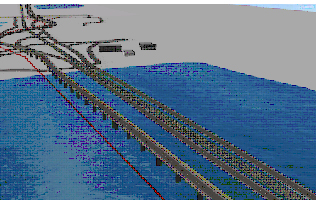
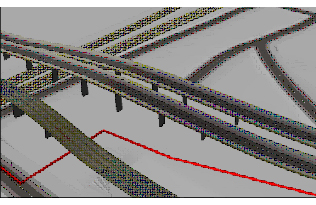
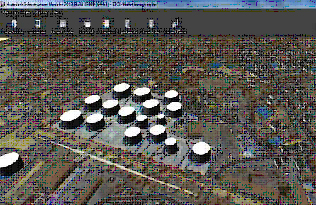
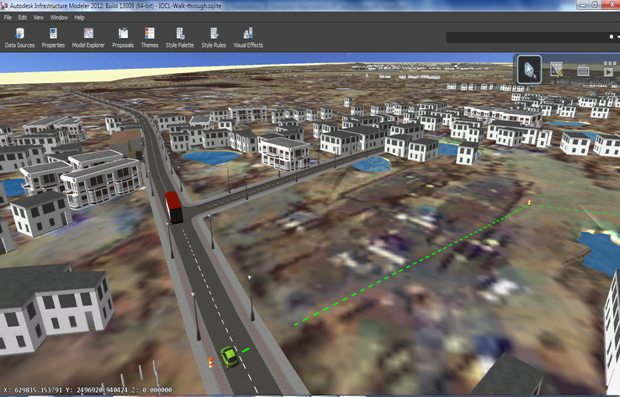
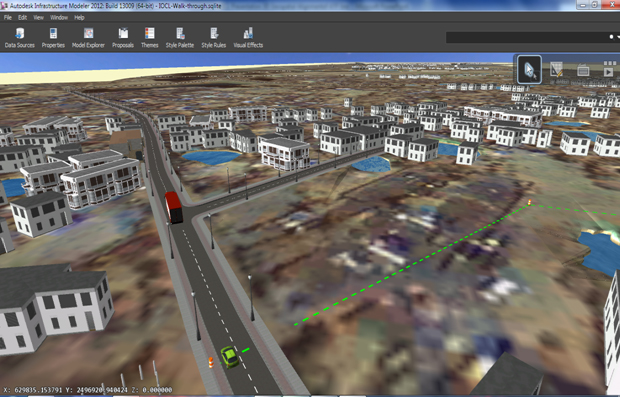
Terrain with pipeline trace on the ground
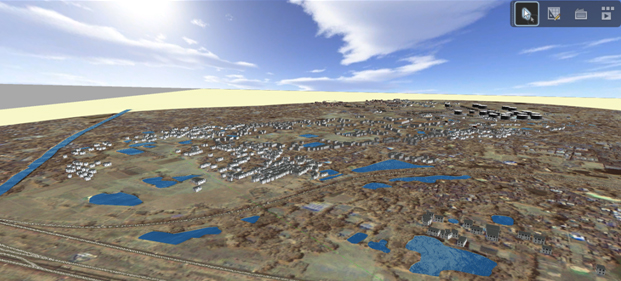
Terrain tilted to horizon view (same view frame as above)

Request a Callback
